
Pie charts were invented by the Scottish engineer William Playfair, but the name for these visual representations of data came later. In other countries, this type of graph goes by names for other round foods. In France, a pie chart is sometimes called a camembert, and in Brazil, it’s a grafico de pizza. This is part of a complete episode.
Transcript of “International Pie Charts”
You’re listening to A Way with Words, the show about language and how we use it. I’m Grant Barrett.
And I’m Martha Barnette. Grant, you know what a pie chart is, right?
Yeah, sure.
It’s one of those graphic representations of data, right?
Round with the triangular wedges.
Yeah, little wedges that represent different parts of the whole.
Well, you know, the image of pie charts is so familiar that it’s hard to imagine a time when we didn’t have them.
But of course, there was such a time.
And apparently the guy who invented the pie chart was a Scottish engineer named William Playfair.
This was back in 1801.
But here’s the thing.
He never bothered to name this type of graph.
We didn’t see the word pie chart until the early 1920s.
Now, why am I so excited about pie charts?
I don’t know.
Because do you know what they call a pie chart in French?
Playfair.
Le Playfair.
Le Playfair.
Oh, after the guy?
No, they call it a camembert.
Oh, after the cheese wheel.
Isn’t that wonderful?
I love that.
A camembert.
Yeah, yeah.
Now, there are different terms in France.
You know, there are terms that translate as circular diagram.
But it’s also commonly called in many parts of France the camembert.
And you know what else is really cool?
You know what they call it in Brazil?
Oh, I have no idea.
The guava.
The guava.
No.
Oh, wow.
No, they call it the grafico pizza.
The graphical pizza.
The pizza graphic.
Isn’t that great?
That’s great, yeah.
It’s just a reminder that sometimes it takes looking at terms in other languages to give us new insights about the terms.
It’s true.
Because, I mean, when do you ever think about pie when you’re thinking about a pie chart, really?
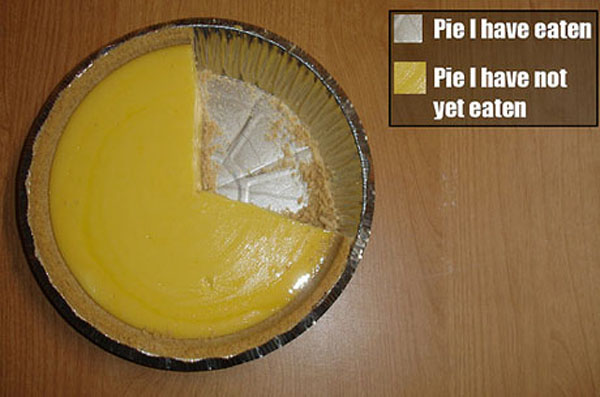
Well, there is a famous graphic that goes around, which actually is a picture of a pie with a slice taken out,
And the caption is, a pie chart showing the amount of pie that I ate.
Yeah, I guess in that case, you’re right.
So there’s culture embedded in the language, sometimes deeply, but here on the surface.
Yes, culture, history.
I love it.
Emotion.
This is the place to find out more about those kinds of things.
Email words@waywordradio.org.
At the Twitter handle, W-A-Y-W-O-R-D.
And we’re on a Facebook, in a Facebook group, and a Facebook page.

